Available for all paid plans.
The Beamer Dashboard is your centralized real-time command center for managing all product communications, feedback, and user engagement metrics in one unified interface. This powerful tool helps product teams track performance metrics, analyze user sentiment, and make data-driven decisions without switching between multiple platforms.
The Beamer Dashboard brings together your changelog, NPS, and feedback data in a single view, giving you comprehensive visibility into how users interact with your product communications.
Key benefits
Actionable insights at a glance: Transform scattered data into clear business decisions with our unified dashboard that reveals patterns across Changelog, Feedback, and NPS metrics in under 60 seconds.
From hours to minutes: Eliminate repetitive report creation with our streamlined dashboard that lets you instantly filter and segment performance data by product, content type, or time period—all from a single dashboard.
Seamless exploration: Navigate with purpose through your data landscape. One click directly takes you from high-level dashboard insights to the content that matters most to your decision-making.
Top-level metrics
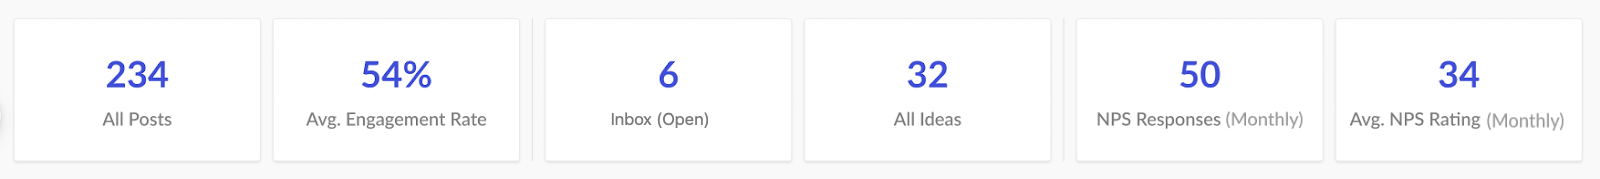
The top-level metrics provide insight into your overall product communication performance for all product communications. Click on an individual metric to open its details for more actionable insights.
Metric | Description | Update Frequency |
|---|---|---|
All Posts | Total number of posts associated with the product. | Real-time, when new posts are added |
Average Engagement Rate | Calculates the proportion of viewers interacting with your content, giving you a clear measure of audience engagement. | Real-time based on user interaction |
Inbox (Unread) | Total count of unread or open messages in the inbox. | As soon as new messages arrive or are marked read |
All Ideas | Total count of all ideas associated with the account. | Real-time as ideas are submitted or resolved |
NPS Responses (Monthly) | Number of NPS responses captured every month. | Real-time as responses are received |
Average NPS Rating (Monthly) | Average NPS rating for the current month. | Real-time as responses are received |
Viewing and navigating data
The tabs below the top-level metrics change the chart data below for Changelog, Feedback, and NPS. Click each tab to view its respective chart data.
Changelog
Monitor unique views and engagement rate for all Changelog posts, analyze performance metrics, and user engagement.
Engagement Metrics
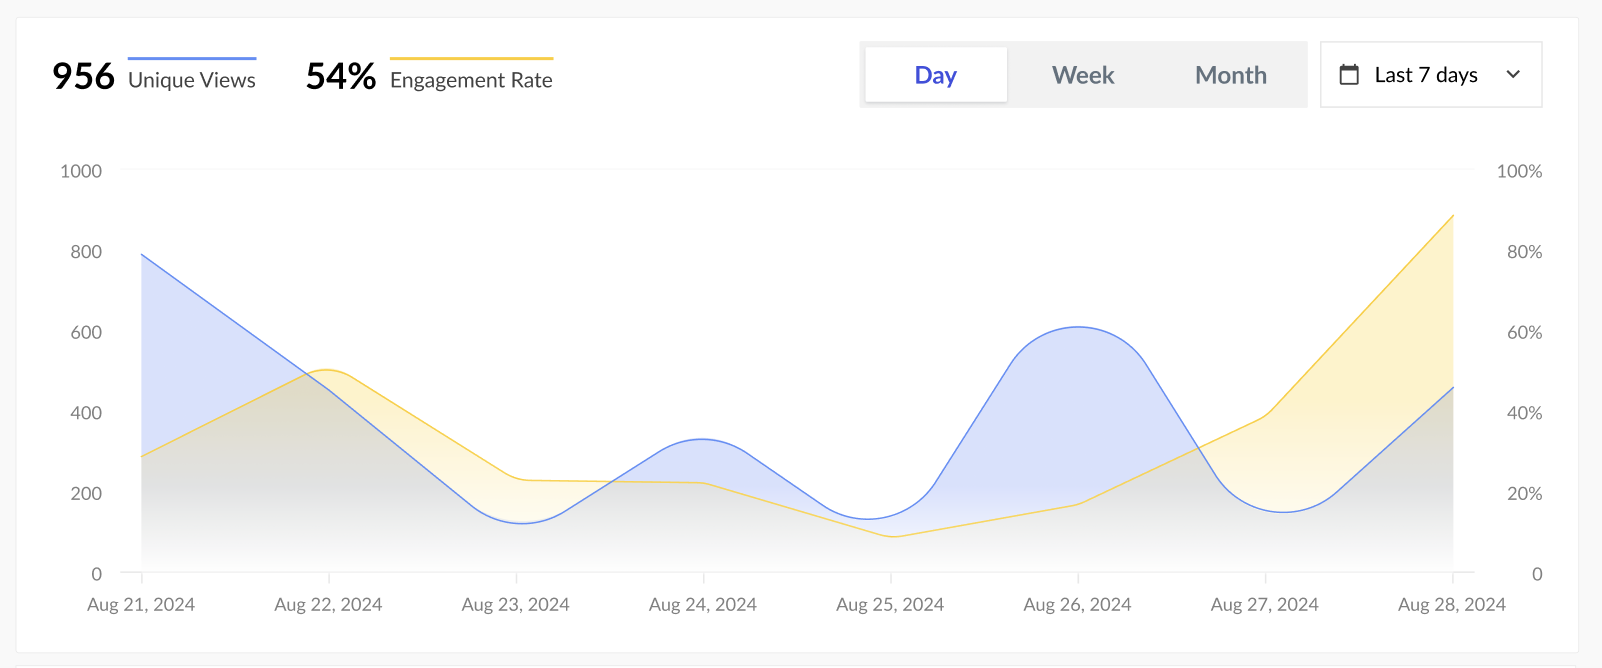
Hover your cursor over the graph to get a snapshot of specific metrics for that time period, and select the Day/Week/Month options or customize the date range using the drop-down of pre-defined date ranges. (Defaults to the last 7 days.)
Latest Post Metrics
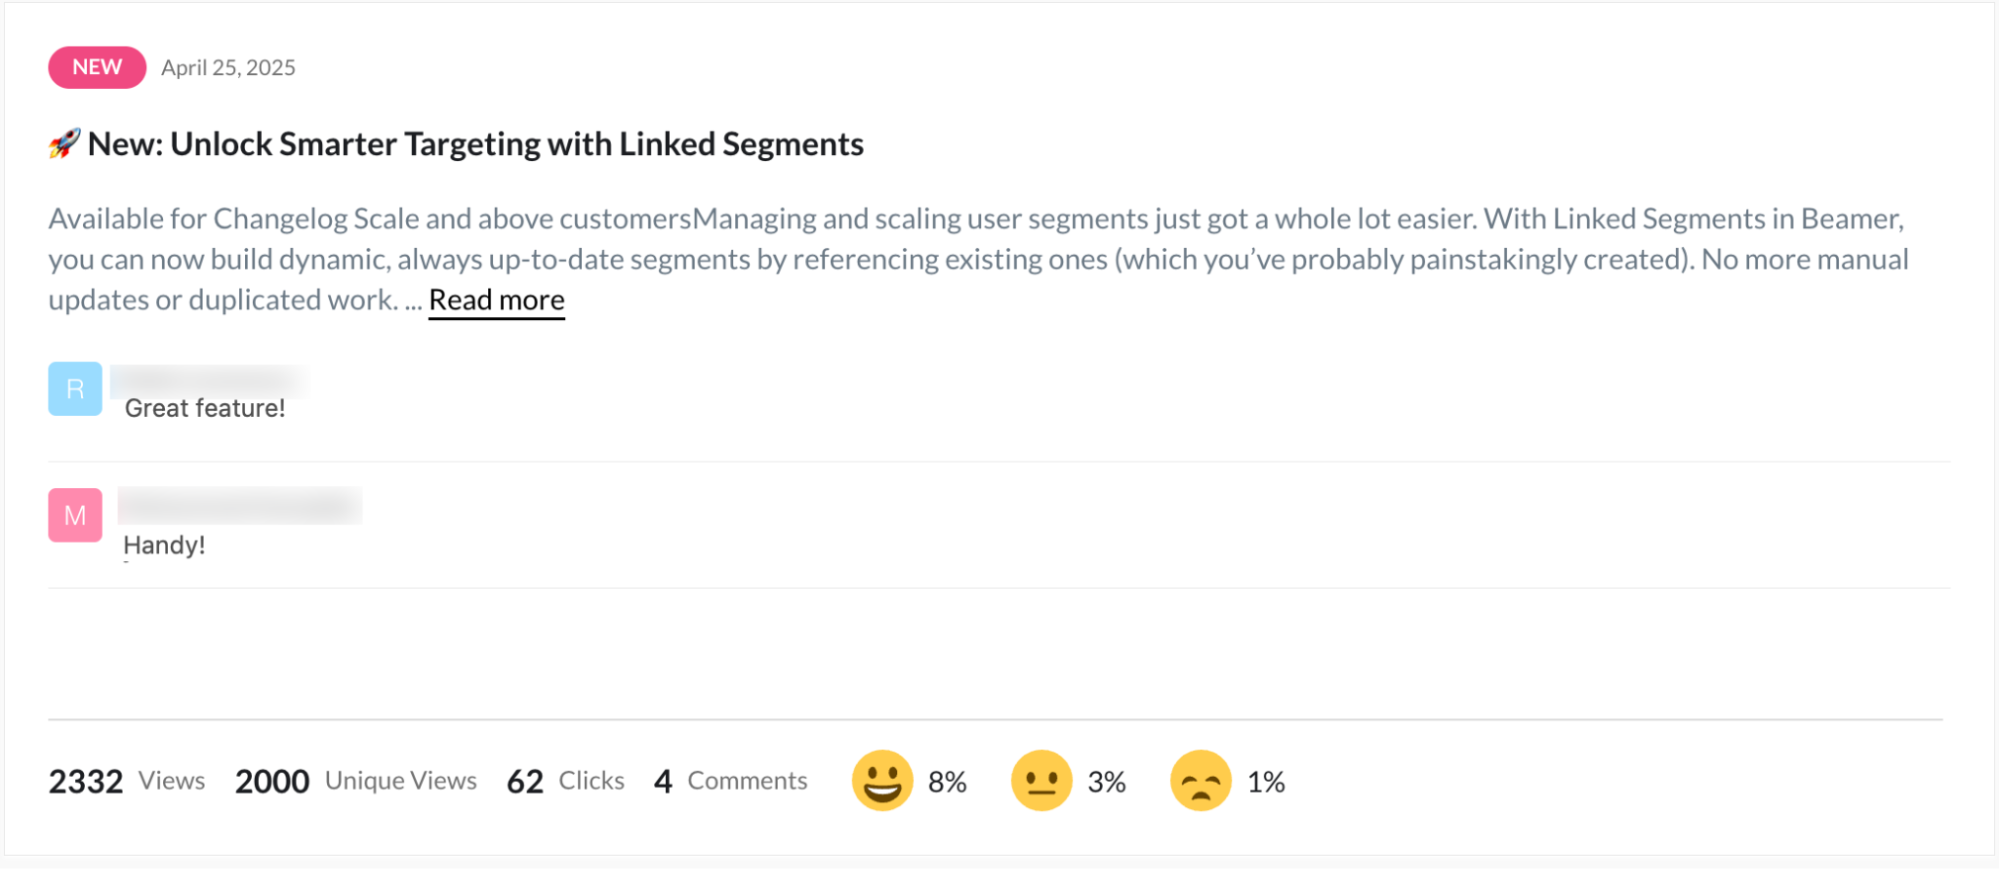
The latest post section displays the most recent Changelog post and the three latest comments.
View post performance for views, unique views, clicks, comments, and ratings at the bottom for cumulative metrics for this post.
Click through any metrics at the bottom for a more detailed view of the activity behind these stats.
Top and Lowest Performance Metrics
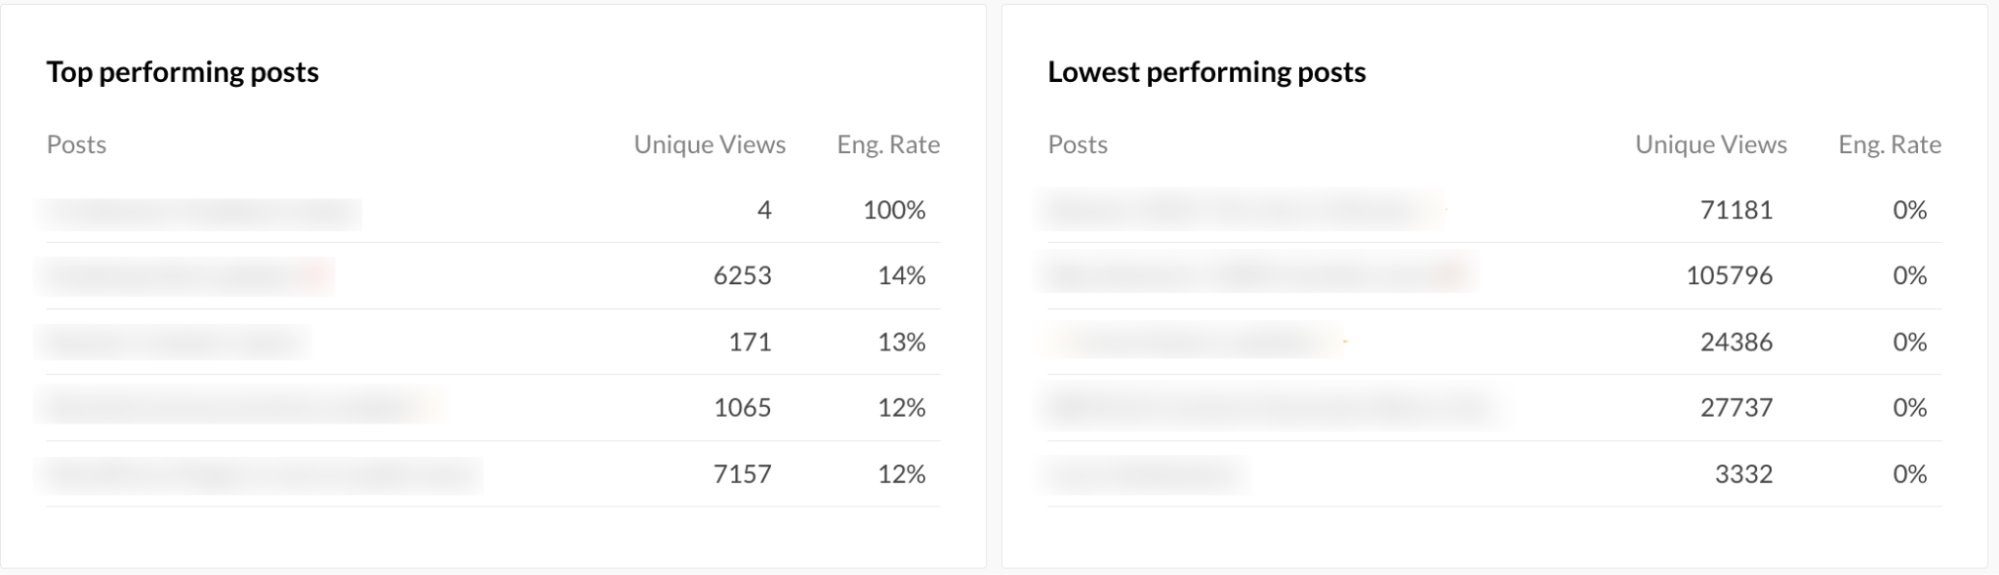
Compare each post's unique views and engagement rate to quickly compare performance, grouped by top-performing and lowest-performing.
Click a post title to view more detailed analytics and metrics.
These post-performance metrics will update automatically as new metrics are available, reflecting changes in post-performance activity over time.
Feedback
View the latest ideas and get detailed insights from source data with a single click. Click the chart elements for New Ideas, New Comments, or individual Feedback to view detailed data.
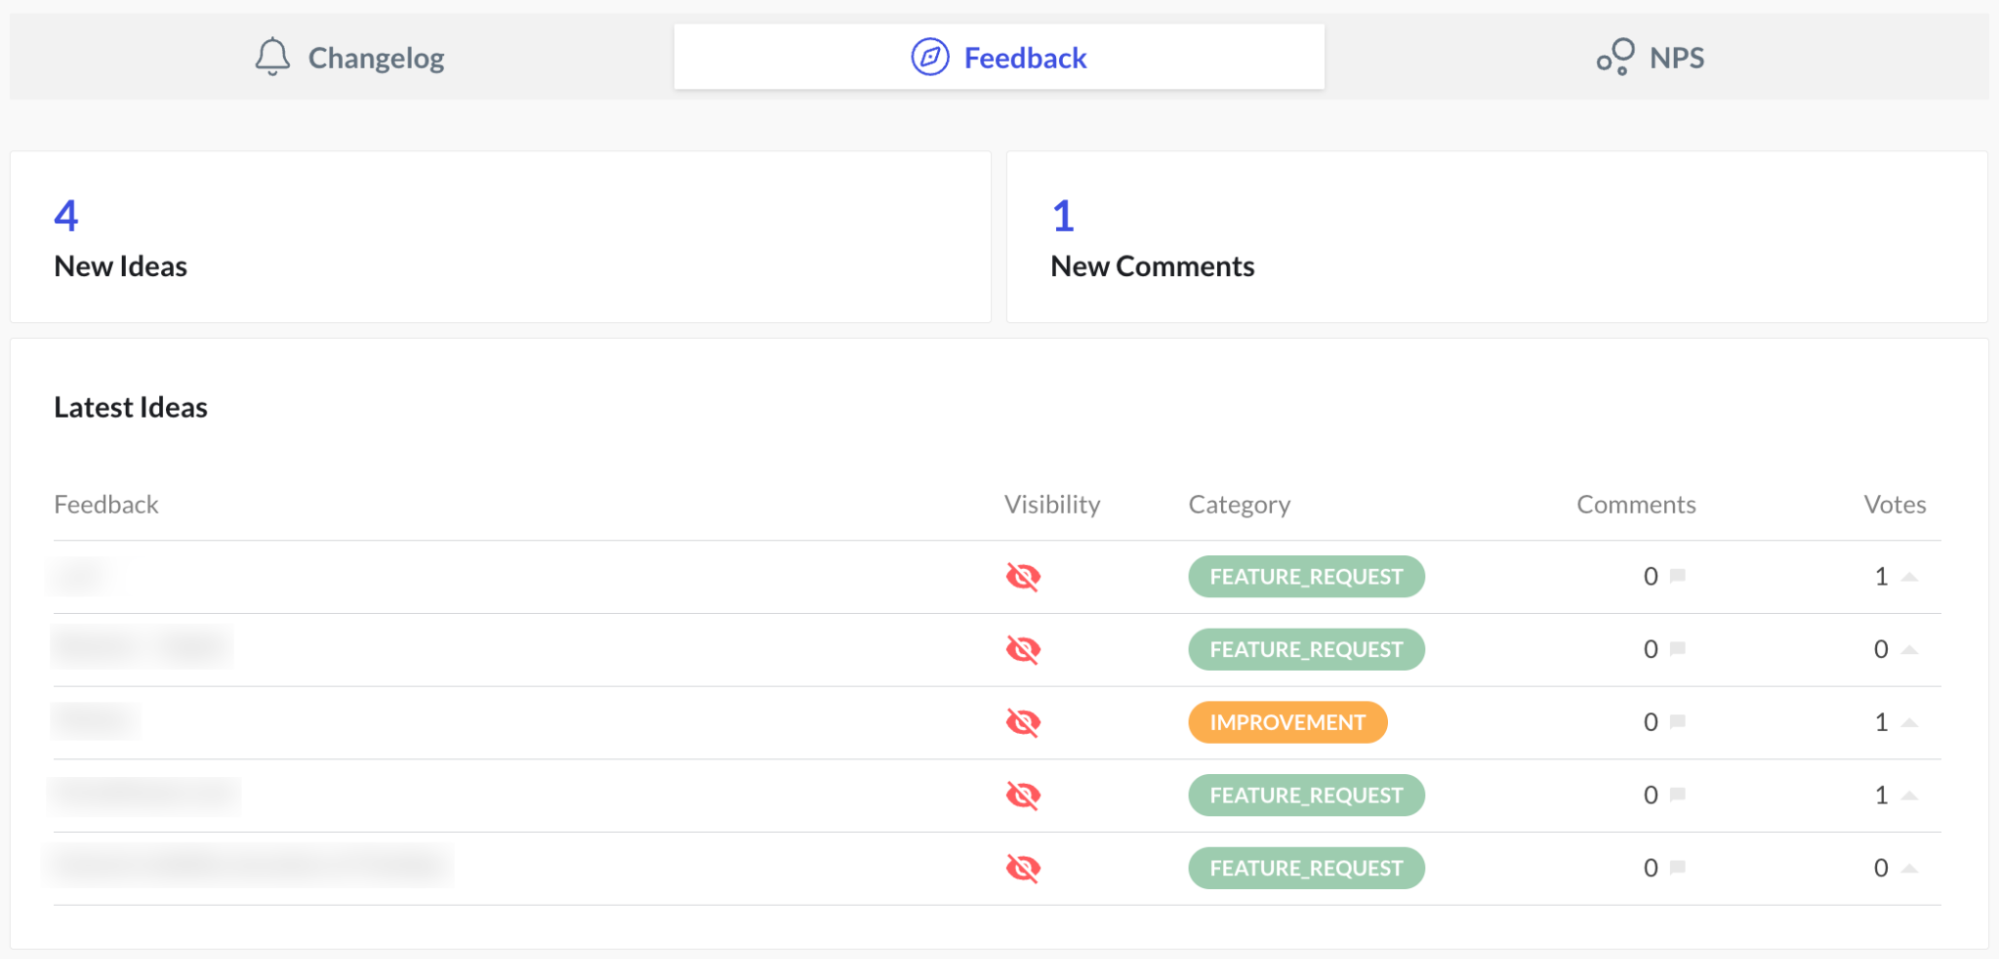
Latest Ideas
New Ideas and New Comments
Beamer Pro accounts:
View the number of new ideas and comments for the last 7 days at a glance. The count will change in real time as you receive new submissions. Click the count to view the new ideas or new comments for deeper insights
Latest Ideas
See user engagement for your latest five ideas, with category, the number of comments and votes for each, and whether the idea is public or private.
Click an idea title to view its details.
Roadmap
Use the Roadmap section to view the status.
Private (internal) and external (public) ideas are displayed by default. To filter the list, use the Visibility drop-down menu.
Scroll up/down to view ideas that may be listed below the bottom of the page.
Click an idea title to view its details.
NPS
View Net Promoter Score (NPS) responses collected over time with average NPS ratings for the current period, and analyze how users respond to the product. Click the chart elements for NPS response data, monthly ratings, and breakdowns of respondent types. (e.g., promoters, passives, and detractors).
NPS Score
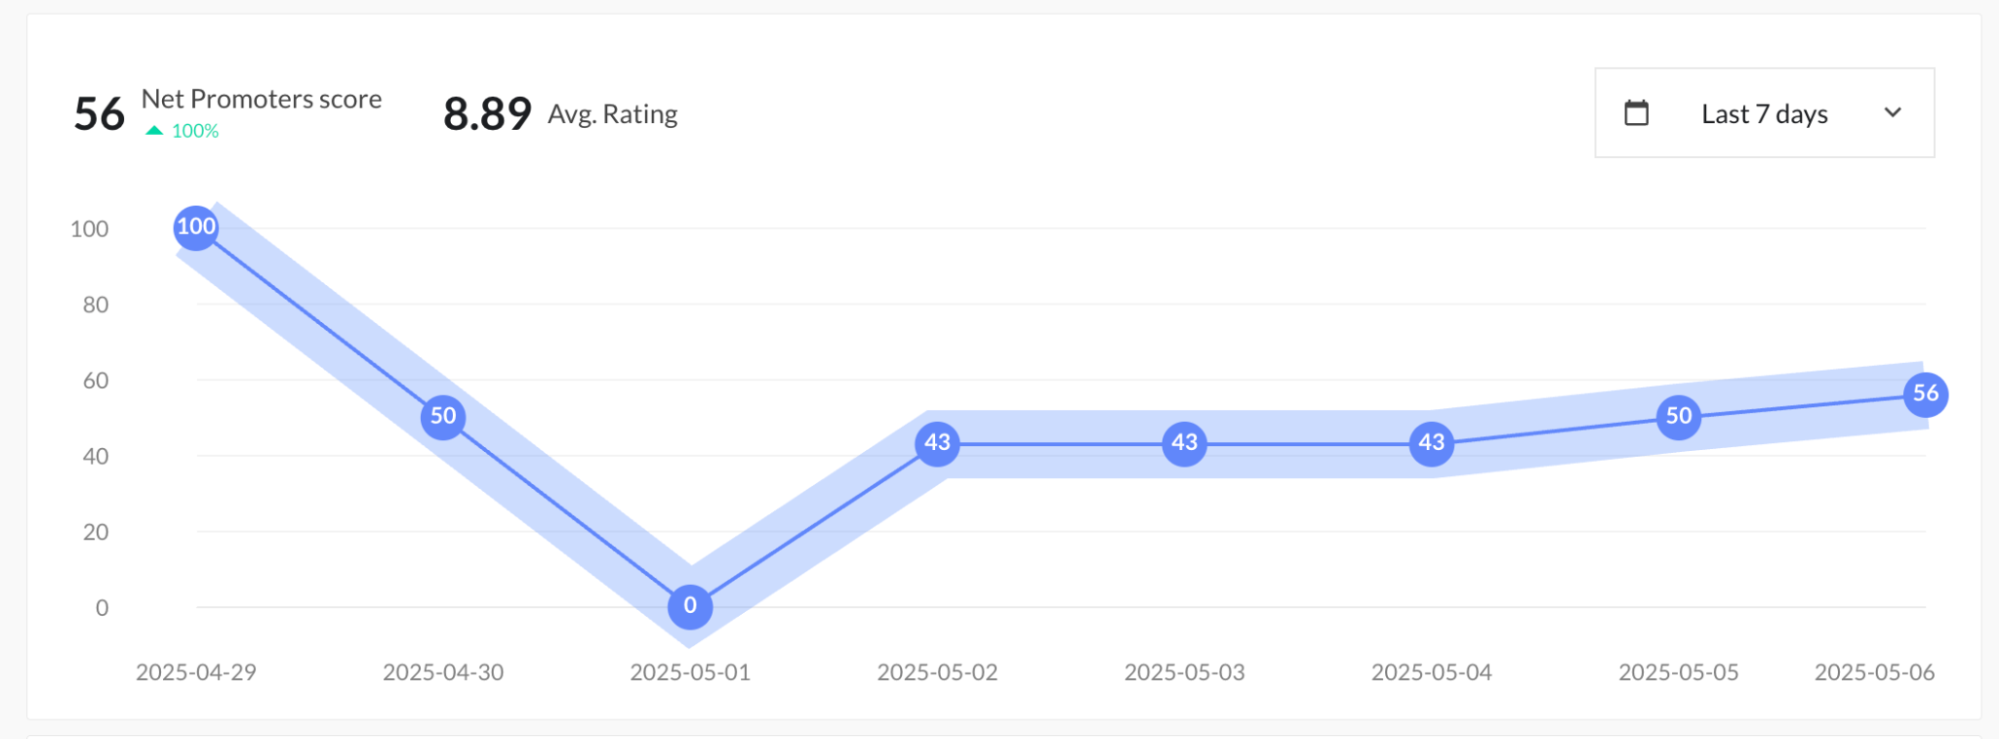
The graph’s time period defaults to Last 7 days. Use the drop-down menu to customize the date range using the drop-down of pre-defined date ranges.
View the NPS score, the percentage change from the previous time period, and the average NPS rating for the selected period at a glance.
The graph displays the NPS score trends for intervals in the selected time period.
NPS Distribution
Use the distribution trend to analyze your NPS performance for the selected time period to identify upward or downward trends. If your scores are trending downward, it’s a signal that customer loyalty and satisfaction may be weakening. Identify and analyze root causes, and take targeted action to address sentiment.
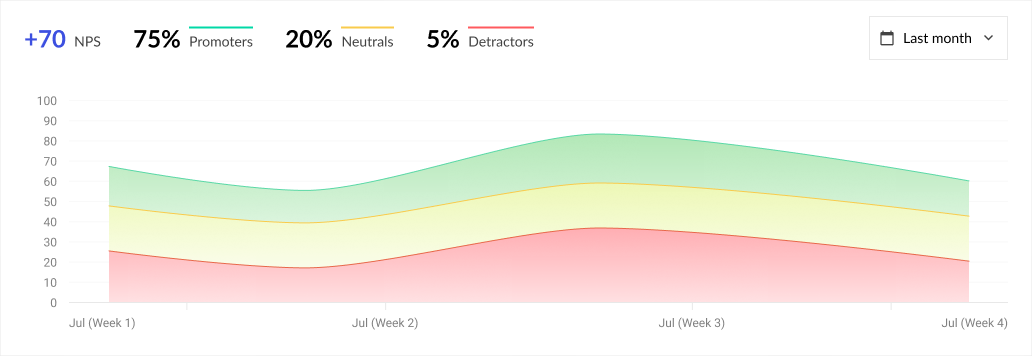
The graph’s time period defaults to Last 7 days. Use the drop-down menu to customize the date range using the drop-down of pre-defined date ranges.
Hover your cursor over the graph to get a snapshot of specific metrics for that time period.
Latest Promoters and Detractors
View the most recent five NPS promoters and detractors' names, comments, and ratings.
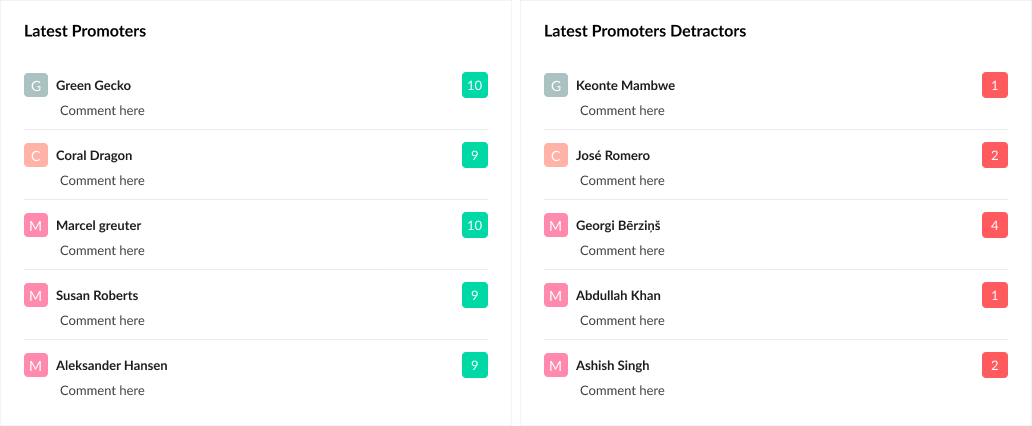
This list will always be the most recent five entries, regardless of time period selections on other graphs.